Real places.
Useful perspectives.
Explore our own demonstration captures. Each client project is scoped to the views, coverage and handoff that serve its intended use.
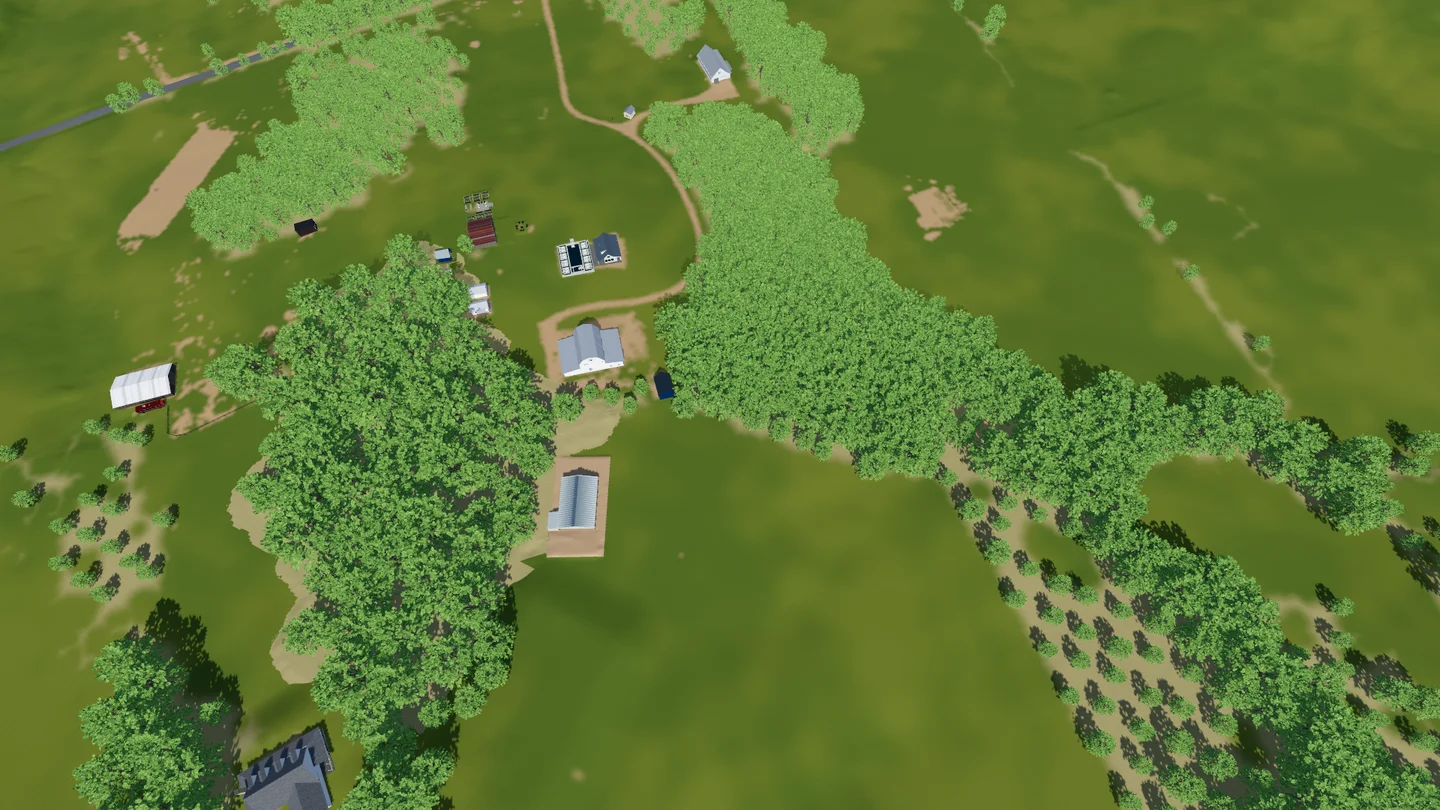
Demonstration captures, clearly identified. The farm is a family property used to develop and demonstrate the workflow. These examples show what the capture produced; they are not certified measurement reports.
See it on a real property
Explore the aerial imagery and 3D views, or read how the farm work helped relate a plan to a real place.
ATLAS WORLDS · VR RECONSTRUCTION
A real place. Another way to be there.
Explore the September 2026 No Alarm Farm rebuild: an in-engine tour, matched scan-to-reconstruction comparisons, and a browser map of the world built for VR.
Watch the film & explore the rebuilt world ↗Choose the result you need
Delivery depends on the agreed visual scope. Image resolution, positioning specifications and measurement accuracy are different things.
Property Overview
A clear view of the whole property, with the features that matter to you identified. Bring the same picture to a family discussion or a conversation with your contractor.
Aerial image overview · Labels and visual annotations · Browser view and printable overview
Atlas Worlds
Explore a real place in photoreal 3D. Share the setting, buildings and visible surroundings with someone who cannot be there.
Photoreal 3D reconstruction · Browser-based exploration · Agreed views and capture coverage
Site Record
Keep a dated visual record as a property changes. Consistent viewpoints make it easier to discuss what is visibly different between visits.
Dated aerial imagery · Repeat viewpoints where practical · Visual comparisons for progress discussions
Need measured or certified work?
Atlas is not a licensed land surveying firm. Boundary determination, building siting and setbacks, engineering design, contours and quantity reports are outside these visual packages. Requests needing measurements or professional certification require a separate scope review before we can quote or accept them.
Discuss the intended useYour site, in that detail.
Tell us what you want to see, understand or share. We will scope the capture and explain what the finished result can support.